Core capabilities
AI agents in Lightdash allow you to:- Ask questions in natural language - Simply type what you want to know about your data, like “What’s our total revenue by region?” or “Show me user growth over the last 6 months”
- Get instant visualizations - Receive bar charts, time series, and tables automatically generated based on your questions
- Explore interactively - Follow up with additional questions, drill down into specific data points, or request different chart types
- Maintain conversation context - AI agents remember your conversation history, so you can build on previous questions and refine your analysis
- Provide text-only responses - Get answers in natural language when visualizations aren’t needed
- Guide you to the right data - Direct you to the most relevant explores or tables for your questions
- Discover existing content - Find and share relevant charts and dashboards that have already been created in your project
- Generate complete dashboards - Create multiple related visualizations at once that tell a cohesive story about your data, perfect for executive summaries or thematic analyses
SQL mode
SQL mode lets the agent reach for raw SQL when a question can’t be answered from the semantic layer alone — for example, when the data exists in your warehouse but hasn’t been modeled as an explore yet. With SQL mode on, the agent can list warehouse tables, describe their columns, and run SQL queries against your warehouse. SQL mode is off by default on every new thread. You opt in per conversation using the SQL mode toggle below the message input.When to use it
- The data you need lives in a warehouse table that isn’t part of an explore.
- You want a one-off lookup, audit, or shape-of-the-data check before modeling it.
- The agent has already told you it can’t answer from the semantic layer.
Who can use it
The SQL mode toggle is visible only to users who hold themanage:SqlRunner ability — the same permission required to use the SQL Runner page. If you don’t see the toggle, ask a workspace admin to grant SQL Runner access to your role.
How approvals work
SQL mode is gated by a human-in-the-loop check on every query:- You flip SQL mode on for the thread.
- You ask a question. The agent drafts a SQL query.
- Lightdash shows the proposed SQL inline and waits for you to Approve or Reject before anything runs against your warehouse.
- Approved queries return results to the agent, which then summarizes or visualizes them.
SQL mode in Slack
Slack-triggered prompts can only use SQL mode when your organization has the “Require Slack users to authenticate with Lightdash” setting (aiRequireOAuth) turned on. Without it, Slack messages run under a shared workspace-default identity, so SQL execution is disabled fail-closed regardless of the toggle. See Slack AI bot setup for how to configure OAuth.
Asking about a chart or dashboard
You can launch an AI conversation with a chart or dashboard pre-loaded as context. From the resource’s⋯ menu, click Ask AI Agent.
This opens a new tab on the new-thread page for your default agent. The chart or dashboard appears as a pinned context card above the input, and the agent treats it as the subject of the conversation.
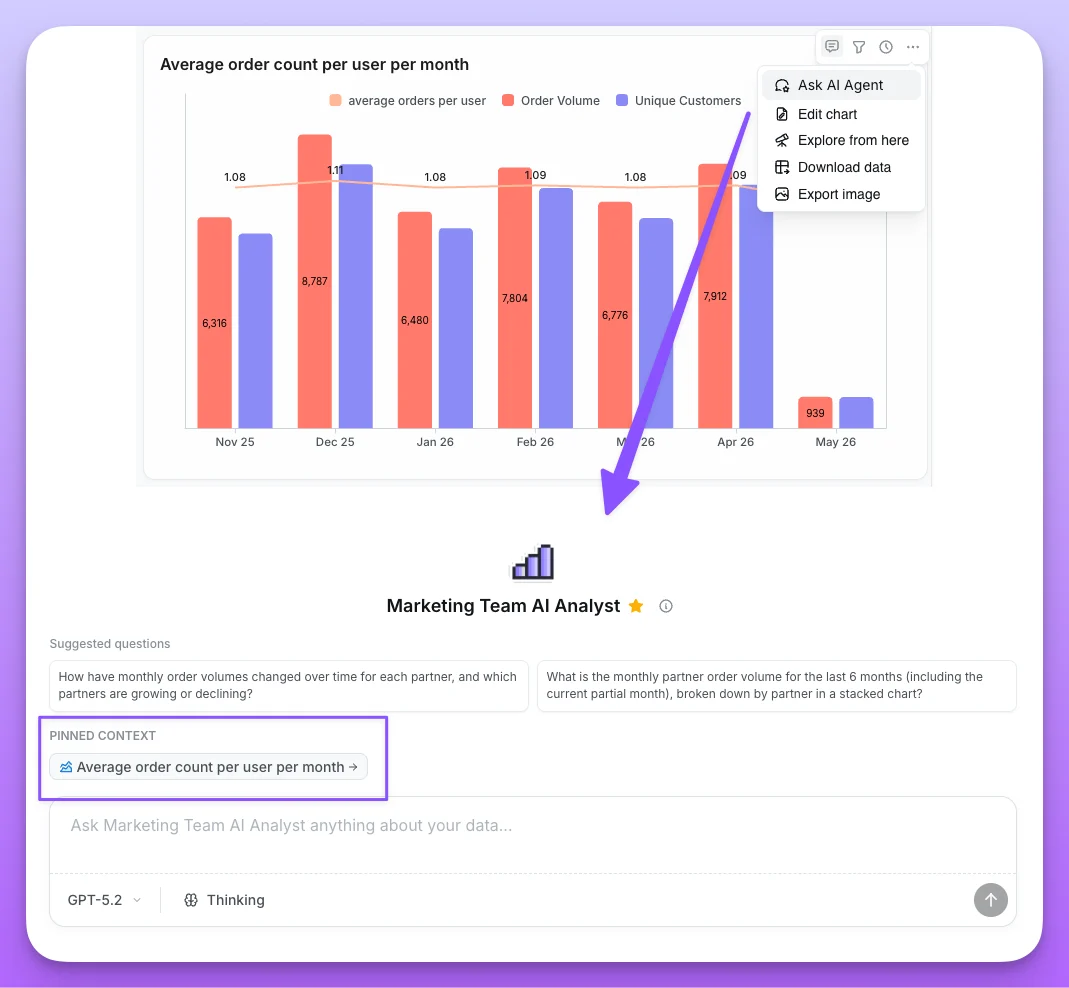
Pinned context
- The pinned card stays visible above your message in the thread, so anyone reading later can tell what was being discussed.
- Click the pinned card to open the chart or dashboard in a new tab.
- The pinned context persists across follow-up messages — “now break it down by region” still refers to the originally pinned chart.
What you can ask
When you pin a saved chart, the agent can read its actual data (subject to your data access setting). It honors the chart’s saved filters, sorts, and custom metrics, so you can ask:- “Why is this trending up?”
- “Are there outliers in this chart?”
- “Compare this chart’s last 30 days to the previous period.”
Example use cases
Advanced visualizations with window functions
AI agents can handle complex analytical queries that would traditionally require writing intricate SQL or YAML configurations. In this example, we demonstrate building a 3-month rolling average visualization using nothing but natural language.
This demo shows:
- Creating complex window function calculations with plain English
- Building a 3-month rolling average without writing SQL or YAML
- AI agent understanding your semantic layer context automatically
- Generating production-ready charts from a single natural language query
- No need to manually configure partitions, ordering, or frame clauses
- From question to visualization in seconds, not hours
FAQs
- Does Lightdash store the query data?
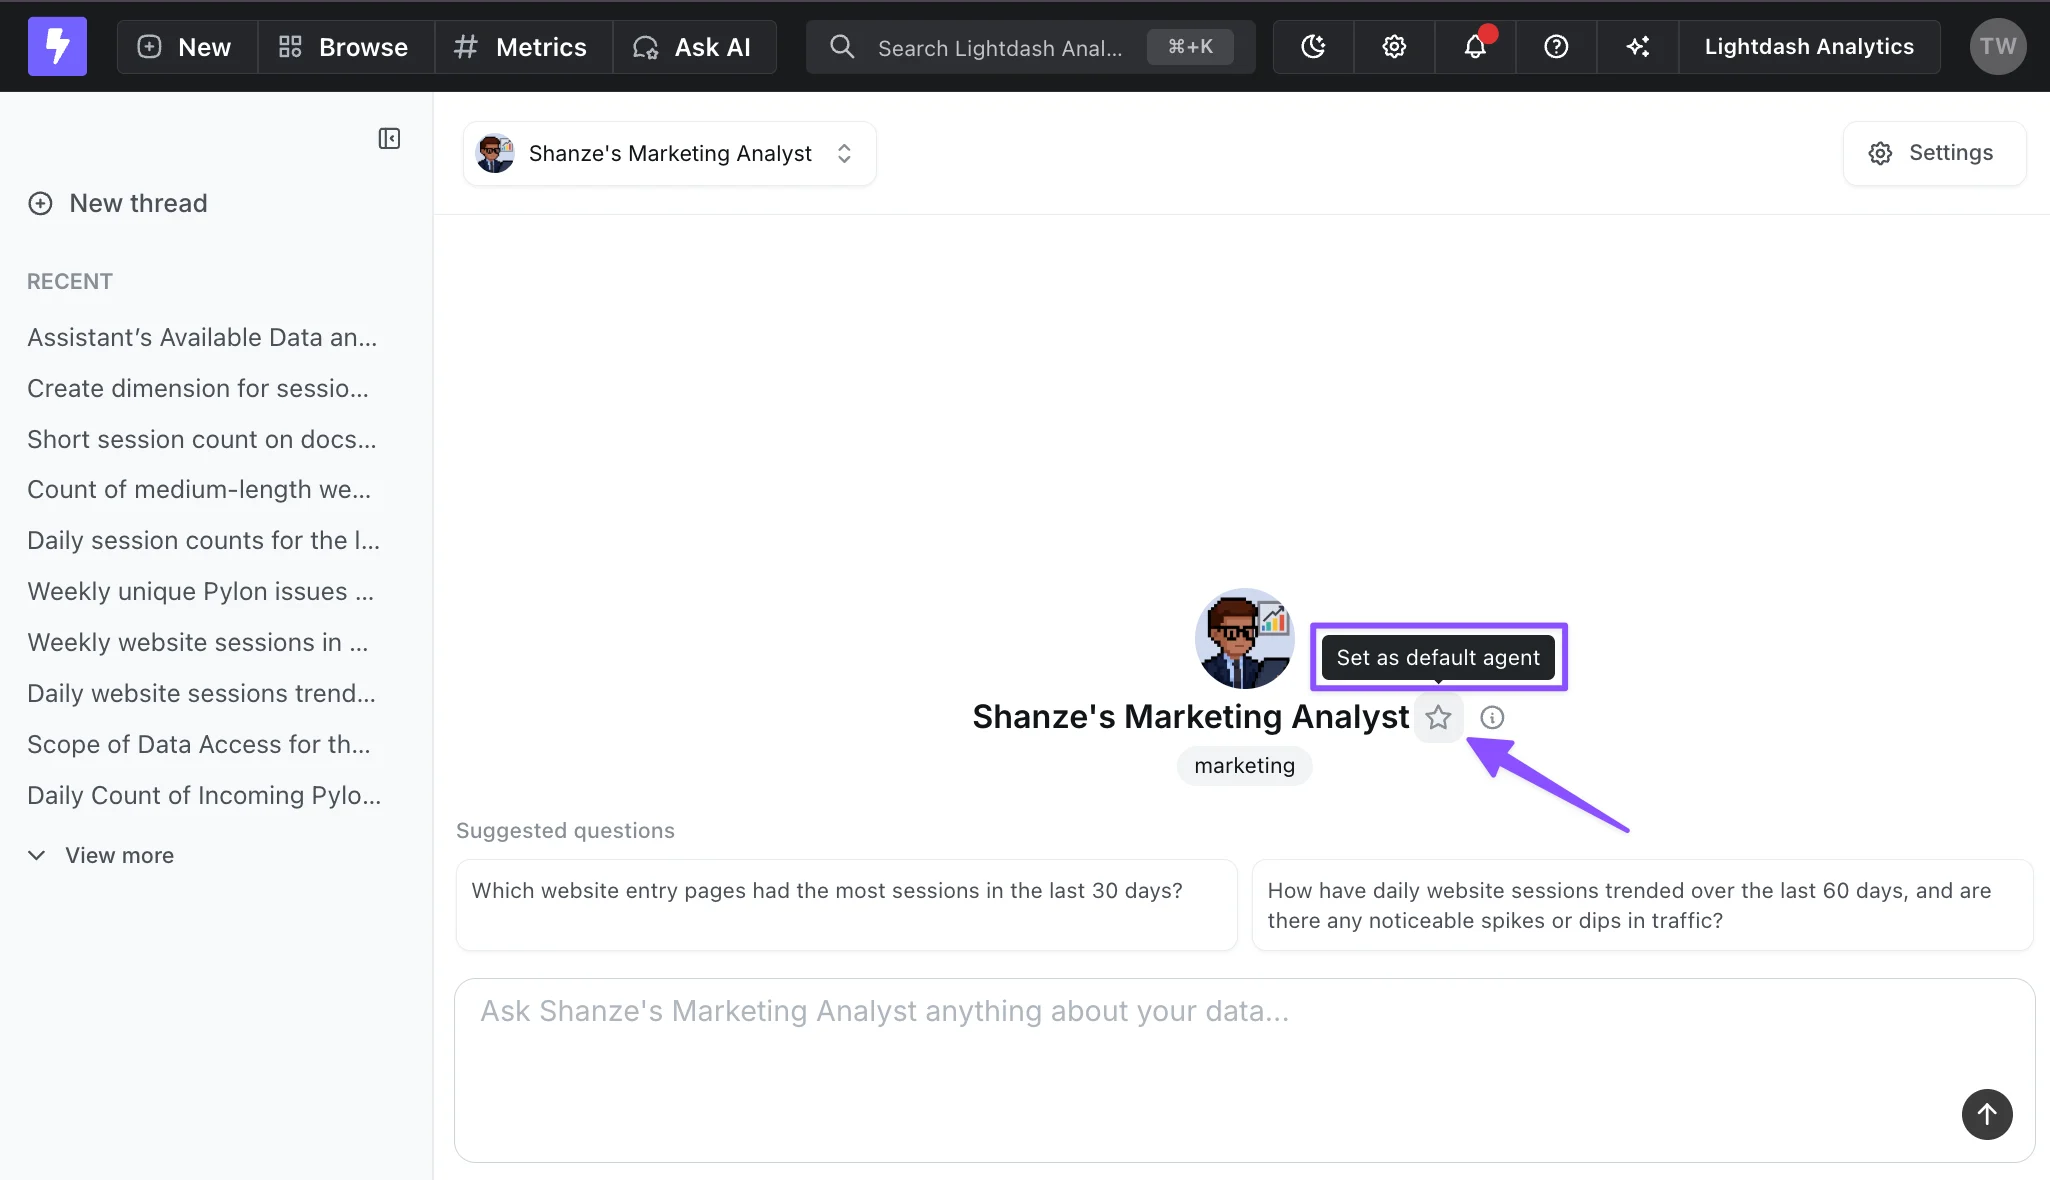
- Can I assign a default agent?